Running ads is only half the job of a traffic manager. The other half — and arguably the most important — is knowing how to track what’s happening and analyze the data. If you can’t read your campaign results, you can’t improve them. And if you can’t improve them, you’re wasting money.
In this article, you’ll learn how to monitor your campaigns, which metrics matter, and how to make smart decisions based on real performance data.
Why Tracking and Analysis Matter
Every successful campaign is built on feedback. When you track your campaigns:
- You identify what’s working and what isn’t
- You make data-driven optimizations
- You increase your return on ad spend (ROAS)
- You avoid wasting budget on underperforming ads
Without tracking, you’re just guessing — and that’s not a strategy.
What Tools Should You Use?
There are several tools that help you track and analyze your campaigns. Some are built into ad platforms, while others are external and offer deeper insights.
Here are the essentials:
- Meta Ads Manager – Tracks performance of Facebook/Instagram ads
- Google Ads Dashboard – Gives complete ad insights for Search, Display, and YouTube
- Google Analytics – Monitors user behavior on your website
- Google Tag Manager – Helps manage and organize tracking codes
- UTM Parameters – Used to tag links and track traffic sources
- Hotjar or Microsoft Clarity – Visualize how users interact with your site (heatmaps, scrolls)
Setting Up Tracking the Right Way
Before launching any campaign, make sure your tracking is properly installed.
Steps to follow:
- Add your Facebook Pixel or Google Tag to your site
- Set up custom conversion events (purchases, leads, sign-ups)
- Use UTM links to track campaigns in Google Analytics
- Test everything before launching (use Pixel Helper or Tag Assistant)
Tip: Always track the action that matters most — not just clicks or visits, but conversions.
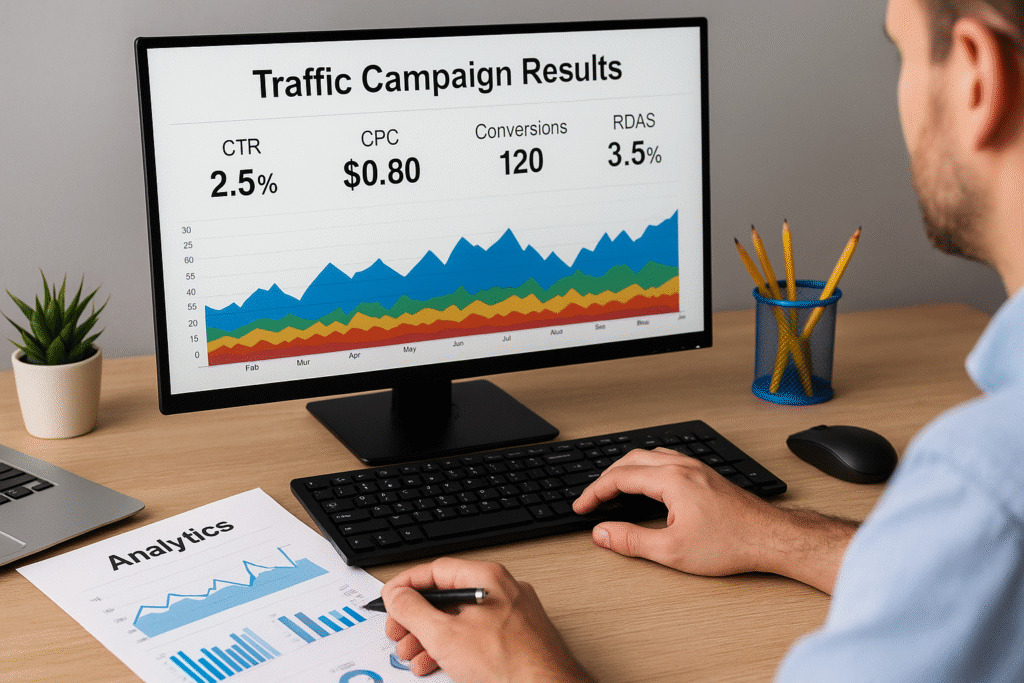
Key Metrics You Must Understand
Here are the core performance indicators you should monitor daily:
- CTR (Click-Through Rate)
Shows how many people clicked your ad out of those who saw it. Higher is better. - CPC (Cost Per Click)
How much you pay for each click. Lower costs mean better efficiency. - Impressions
Number of times your ad was shown. - Reach
Number of unique people who saw your ad. - Conversion Rate
Percentage of visitors who completed the desired action (purchase, lead form, etc.). - CPA (Cost Per Acquisition)
How much you pay to acquire one customer or lead. - ROAS (Return on Ad Spend)
How much you earn for every dollar spent. A ROAS of 3 means you earn $3 for every $1 spent.
Focus on conversions, not vanity metrics like likes or comments.
How to Analyze Campaign Results
Looking at data is one thing — interpreting it is another. Use this simple framework:
1. Look at performance by objective.
Are you getting the results you aimed for? If you chose “Leads”, are leads coming in?
2. Compare ad sets and creatives.
Which ones are driving the most results at the best cost?
3. Identify drop-off points.
Are users clicking your ad but not converting? Maybe your landing page needs fixing.
4. Monitor trends over time.
Are results improving, declining, or staying flat? Adjust accordingly.
5. Check consistency.
One bad day doesn’t mean failure. Look for consistent performance over several days.
Common Optimization Decisions Based on Data
Here’s how you might adjust a campaign based on your analysis:
- Low CTR? → Improve your ad copy, image, or headline.
- High CPC? → Refine audience targeting or test a different creative.
- Good CTR but no conversions? → Review the landing page experience.
- High CPA? → Rework the offer or test new audiences.
- Low ROAS? → Reduce ad spend on underperforming sets and invest in winners.
Remember: Always test one change at a time. That’s how you learn what works.
Reporting for Clients or Teams
If you manage traffic for others, clear reporting is crucial. Include:
- Main KPIs (CTR, CPC, CPA, ROAS)
- Budget spent
- Conversion volume
- Wins, challenges, and next steps
Use tools like:
- Google Data Studio (Looker)
- Canva or Slides for visual reports
- Notion or ClickUp for campaign notes
Clear reports build trust and help everyone stay aligned.
What to Remember
Tracking and analysis are not optional — they are the core of every high-performing campaign. Learn how to read data, trust it, and act on it. That’s how you evolve from just running ads to truly managing performance.
Explore more tracking tutorials and data strategies inside our Learning Center to take your traffic skills to the next level.